Analytic Flying’s Capacity Tracker: December 2023 Update
This month’s update of the Analytic Flying’s capacity tracking tool passes an important milestone with the end of 2023. We now have the complete 2023 calendar year, including BITRE data updated through September combined with Analytic Flying’s real time flight tracking using ADS-B alongside our flight and aircraft database. So now that the data are in, what do we see?
Total international capacity in 2023 was down 14% compared to 2019, however this is a significant improvement from the 17% measured last month.
Over the last quarter, total international capacity was down 8% (compared to the same quarter in 2019), again an improvement from 11% measured last month.
In the month of December down 7% compared to December 2019, which was the same as estimated last month.
While capacity continues to return strongly, the pace of capacity returns has slowed in recent month. The significant increase in absolute capacity between November and December should be viewed in the content of typical seasonal capacity increases in December and January.
What is happening at the major gateways?
Last month we observed the rather inconsistent capacity returned between cities. Melbourne and Sydney led capacity returns among the major gateways, with Perth close to the average, but Brisbane significantly lagging.
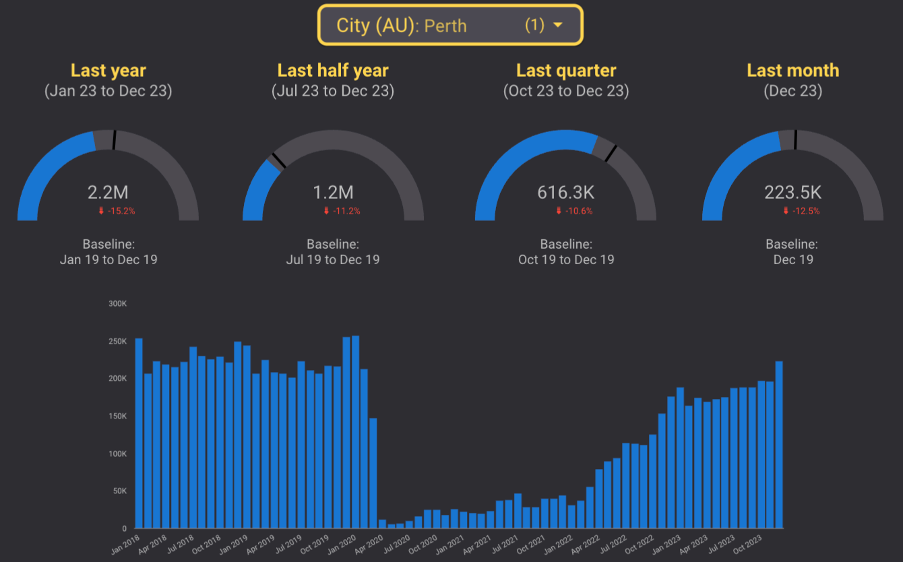
Long term trends have improved in all cities. 2023 capacity to Melbourne and Sydney are down 10% and 12% compared to 2019 (13% and 14% last month), while Brisbane and Perth are down 30% and 15% compared to 2019 (32% and 17% last month).
However, shorter term trends show the slowdown in capacity returns, led by Sydney and Perth. Over the last quarter, Sydney and Perth are down 4% and 11% (3% and 10% last month). Melbourne and Brisbane do not follow this trend with capacity over the last quarter down 5% and 20% (improvements on 3% and 28% last month).
During the month of December, Sydney and Perth are down 3% and 12% compared to 1% and 10% last month, while Melbourne and Brisbane are down 2% and 13%, improvements on 5% and 18% down last month.
Use the Analytic Flying capacity tracker to analyse trends yourself!
By airline, country and region?
Last month we took a far more detailed look at trends by city, airlines, country and region. The analysis got very dense, very quickly. Instead of doing this again, we will follow-up with several more detailed analyses that can consider more interesting trends in detail.
As a teaser though, the December update shows a marked improvement in capacity returns from China in recent months. 2023 capacity was still down 47% compared to 2019 (55% last month), however capacity over the last quarter was only 16% down (18% last month), and only 7% down in December (17% last month). This highlights the rapidly improving capacity environment. Furthermore, given that China accounted for nearly 8% of Australia’s pre-pandemic international airline capacity, the return of this capacity is important at the macro level.


