

How do Emirates, Etihad, Ethiopian, Qatar & Turkish's hubs stack up?
A snapshot of Dubai, Abu Dhabi, Addis Ababa, Doha & Istanbul's connecting banks
In several recent analyses we focused on the variation in hub design and its impact on scheduling. In one we explored how Emirates uses a banked hub, turning Dubai into an extraordinary global super hub. As a reminder, a banked hub is where arrivals and departures are organised in sequential concentrated groups to maximise the number of connecting route pairs.

The analysis also showed that significant costs that banked hubs incur. Using the example of Australia, we shows how Emirates scheduled flights to/from Australia to connect to/from specific banks in Dubai, requiring aircraft to endure significant ground times in Australia (e.g. Emirates has 5 A380s spending nearly 60 hours on the ground in Australia each day).
Another analysis used this methodology to help understand Qatar Airways’s Doha hub and their scheduling strategy vis-à-vis their joint venture with Virgin Australia. It highlighted how each hub is different, with a varying number of connecting banks with varying breadth and depth.

This new analysis is somewhat more simplistic: rather than taking a detailed analytic approach to each hub like we did with Dubai, it extends the methodology to a more generalisable level with consistent and comparable figures and metrics. Using ADS-B data, we counted the number of scheduled arrivals and departures per hour by the home carrier at each hub. Data was drawn over an identical two day period to account for routes that aren’t operated daily and removing duplicates generated by daily flights (that would otherwise be double counted).
The consistent figures allow easy identification of inbound and outbound banks, and the balance between banked and rolling hubs. Later, we’ll look at some statistical metrics.
Ethiopian Airlines (Addis Ababa)
Ethiopian is something of a phenomenon as the primary connecting hub for traffic between Africa and Asia, Europe and North America, and even between South America and Asia.

Intriguingly, their hub appears to be less banked than expected, with a mixed banked/rolling hub model. This is evident from a morning arrival bank (6-8 am) that is followed by a departure bank (8-10am), however arrivals and departures continue at a steady pace throughout the day in a rolling manner before an evening arrivals bank (7-10pm) followed by a departure bank (10pm-1am).


Emirates Airline (Dubai)
Emirates operates a banked hub model with 4 banks. Emirates’s banks are fairly broad as airport congestion limits the number of flights it can operate during any given hour leading to less concentrated banks. See our previous analysis for more detail.


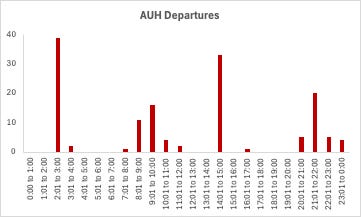
Etihad Airways (Abu Dhabi)
Etihad’s 4 banks are very concentrated, likely a function of ample airport capacity. This concentration is visible from the large variation between arrivals and departures in distinct periods compared to the average. For example, on average there are 6 arrivals and departures per hour, yet a maximum hourly rate of 31 and 39 arrivals and departures, respectively. We will return to these metrics to compare hubs later.

Qatar Airways (Doha)
Qatar’s hub shares similarities to Dubai with a strong early morning arrivals bank (4-7am) and a following departure bank (7-10am). It has broad daytime banks, then an early evening arrival bank (4-7pm) followed by departures (6-9pm), and then a late evening arrival bank (9pm-1am) and departure bank (1-3am). In total, that’s 4 banks, just like Dubai! Notably, Dubai has some rolling traffic between banks whereas Doha has less.


Turkish Airways (Istanbul)
Turkish’s hub doesn’t show a strong bias towards banking with flights spread throughout the day. In many respects this is a classic example of a rolling hub, however there are still distinguish features including a slowdown in overnight flights and a peak in early morning arrivals and departures. This is likely due to strong O&D traffic including domestic flights. Even within the context of a rolling hub there may be elements of banking with flights to/from particular regions focussing on specific time period.


How do we interpret these?
Firstly, the figures are really useful since it allows direct comparison of arrivals and departure banks in each hub, but also allows comparison between different hubs. Secondly, it shows how each hub is designed differently, from Emirates, Etihad and Qatar’s strong banking, to Ethiopians mixed banking/rolling model, and Turkish’s banks within a rolling hub.

We considered various statistical metrics that may be useful. The coefficient of variation (CV) is the ratio of the standard deviation relative to the average. This allows comparison of the variance between samples with different averages. The higher the CV and the higher the ratio of the maximum to the average hourly rates indicates more concentrated patterns of arrivals and/or departures, and thus the concentration of connecting banks. This is clearly indicated by Istanbul being the least banked and Abu Dhabi being the most banked. Surprised? Let us know what you think!