

Mirror, mirror on the wall, who's the longest of them all?
Every few months, a graphic or blog post goes around social media showing the world’s longest flights. It’s enticing since ultra long haul travel is intriguing and ever evolving with new flights stretching the limits of aircraft and our imagination. Australians have always had skin in this game as the country’s isolation has meant that many of the ultra long haul flights have been to/from Australia.
Typically these lists measure the great circle distance between two points. But this can be very misleading. Just because a flight covers a larger distance doesn’t mean it’ll take longer to fly.
The most significant confounder is weather: for example, Qantas’s Perth-London flight has a scheduled block time of 17:50 westbound but just 16:30 eastbound. The difference between these two estimates is the jetstream that generates a headwind on the westbound leg but a tailwind on the eastbound leg.
We might call this the macro-level weather, however flights are also affected by day-by-day variations in weather. For example, despite a scheduled block time of 15:45, over the last year Air New Zealand’s Auckland-New York flight has actually taken anywhere from as little as 14:35 to as much as 16:35 to fly, with an average of 15:12.
This doesn’t even account for airspace challenges. Not only does Qantas’s Perth-London flight have to navigate for the most favourable weather conditions it also has to navigate significant airspace challenges. At present, Iranian, Russian, Ukrainian and Syrian airspace is not available to them, requiring a substantial devision from the great circle route.
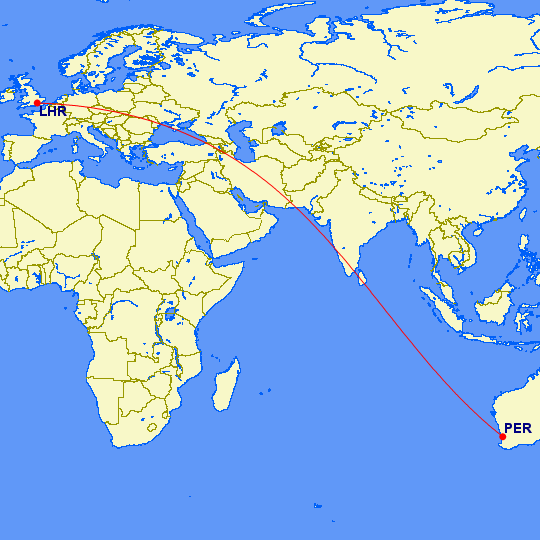
A typical westbound routing (below) shows how the flight skirts these restrictions adding additional flying time. Meanwhile, at times Iraqi airspace has also been unavailable, requiring even further diversions, sometimes as far as Afghanistan! Over the last year, the westbound leg has taken as little as 16:26 and as much as 18:15.

By this point, I hope we’ve convinced you that great circle distance isn’t a great way to measure the longest flight!
Yes, of course we measured the flight times of every flight over the last year!
In typical Analytic Flying fashion, we’ve decided to do some empirical work by measuring the actual flight times over the last year (using ADS-B data) of the 10 longest flights by distance. We cleaned the data by removing diversions, and estimated the minimum and maximum flight times during the period, as well the average, median and variation.
The 10 longest flights by distance is an uncontroversial empirical measure estimating the great circle distance. China Southern’s Shenzhen-Mexico City flight complicated the matter since it operates via Tijuana on the return leg due to take-off performance limitations at Mexico City (it’s hot-and-high). This complicates our analysis since the westbound leg is actually the longer leg.

Given the typical difference between east and westbound legs, we have utilised the longer of the two in each case. The table below shows the ranking of the flights by the longest and average flight times over the last year, also showing the leg used to measure (e.g. New York to Singapore is utilised instead of Singapore to New York). The table is ordered by the rank of the average flight times. Flights that were quicker in time than distance are highlighted in green, while those that were slower in orange.
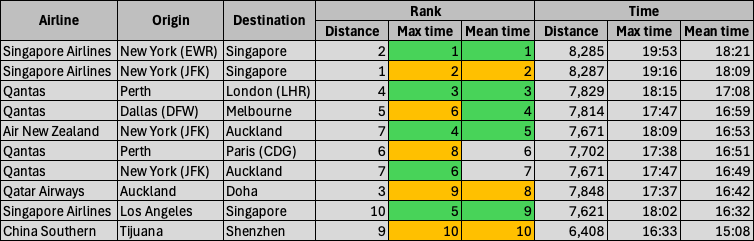
There is some correlation between distance and time, but also some noticeable exceptions. For example, Perth-London is 4th longest by distance, but 3rd longest by maximum and average flight time. Meanwhile, Auckland-Doha is 3rd longest by distance, yet 9th and 8th longest by time.
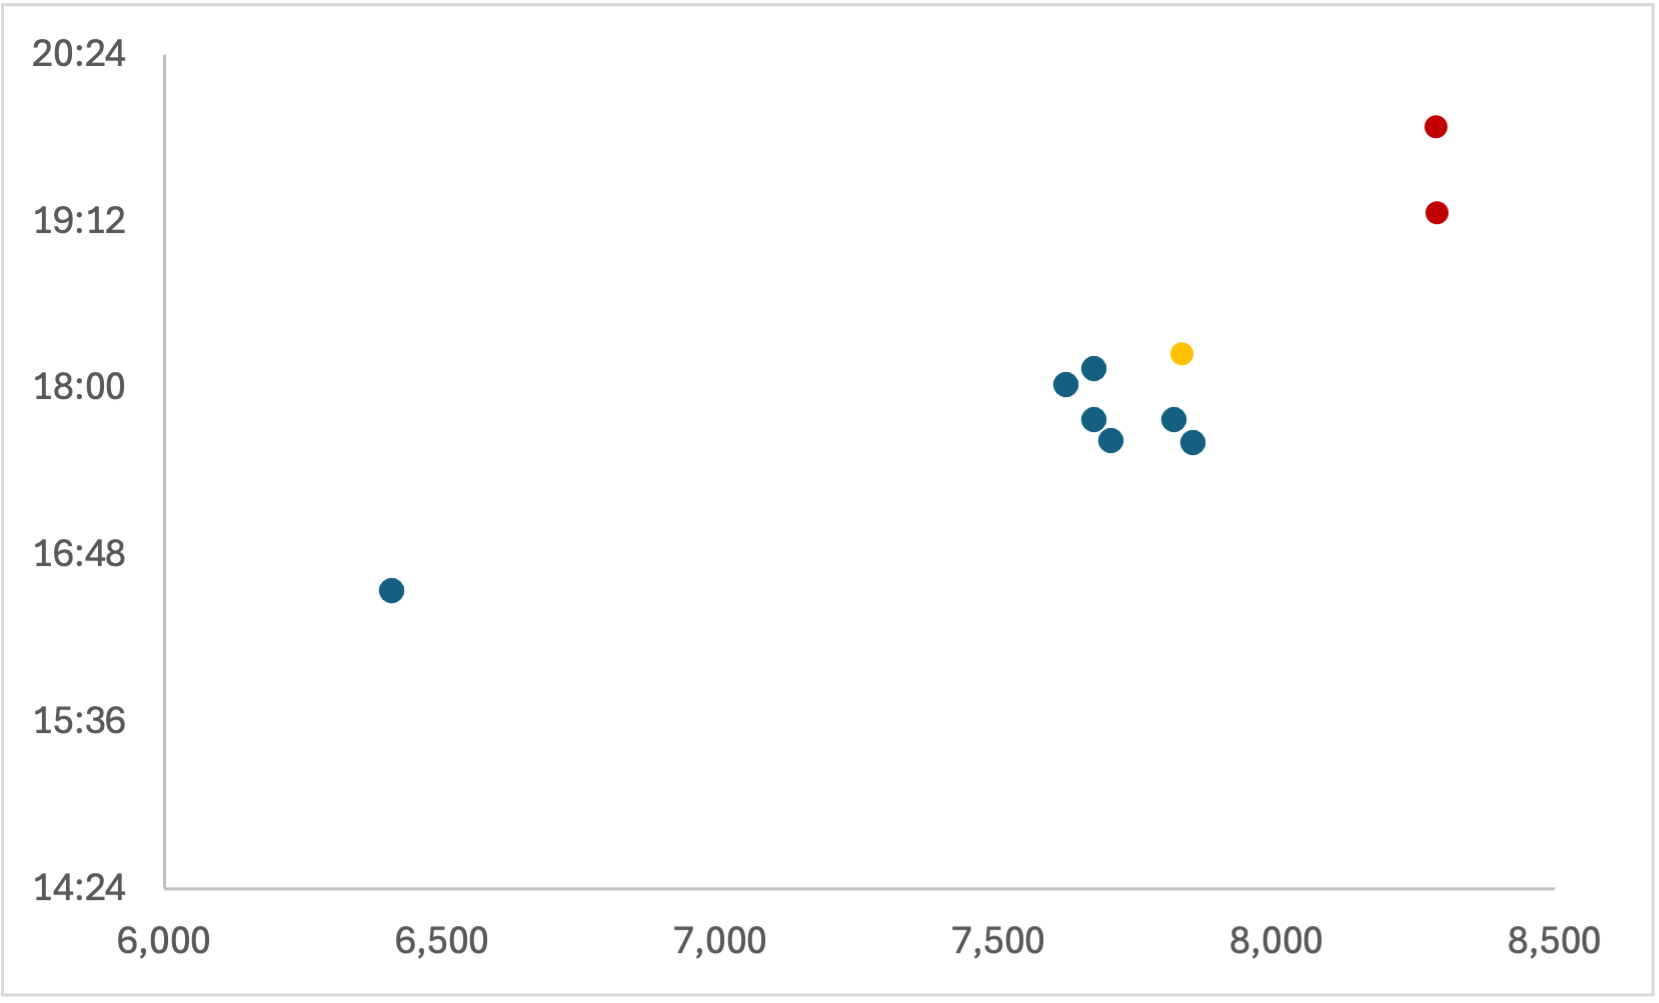
Graphically, a scatterer plot shows the strong correlation between distance and time, but also highlights how flights of similar distance can vary. But one thing is clear: Singapore’s New York flights are the clear winners in the race for the longest flight, and by some margin.
Averages can be deceiving
One thing that averages don’t tell us is the variation in flight times. For example, Perth-London takes anywhere from 16:26 to 18:15, a nearly two hour difference. While the average comes in nicely in the middle at 17:08, but this isn’t the case for some of the other flights.
For example, New York-Auckland (on Qantas) takes anything from 14:50 to 17:47, with the average towards the upper end at 16:49. This variation is measurable in several ways, but a simple measure is the coefficient of variation (ratio of the standard deviation to the mean).

Intriguingly, there is no correlation between the length of flight and this variation, i.e. longer flights don’t have greater variation per se. More likely, variation in flight times is a result of variation in meteorological and airspace conditions. Highlighting this variation further we can show the measured times of all flights during the last year for particular routes. Let’s take Perth-London and Auckland-Doha. Despite them having amongst the lowest variations, the comparative statistics do a disservice to the actual variations in flight times.

But it also highlights the signification differences between flights. In this case, even the shortest Perth-London flight was longer than 19% of all Auckland-Doha flights. Or put another way, the average Auckland-Doha was still longer than 8% of all Perth-London flights. Point being, on any given day the average time might be rather meaningless!
So where does this leave us?
We went down the rabbit whole a little, didn’t we? Apologies for that, but it was fun!
Certainly, distance is a misleading indicator of longest flight. Time is most certainly a more relevant and better indicator, however the time taken for any particular flight varies so much from day-to-day meaning that averages can be quite deceiving.
Nevertheless, one thing is clear, whether by time or distance, New York-Singapore is the world’s longest flight, and by some distance. There’s a big chasing pack, trailing in the distance.