Who stands to benefit from Australia’s decision to block additional market access to Qatar Airways?
In a previous analysis, we discussed the Australian government’s decision to reject Qatar Airways‘s request for additional flights to Australia. The rejection, viewed as protecting Qantas and criticised for stifling competition, contrasts with a similar denial to Turkish Airlines that received less public attention.
The previous analysis delves into the bilateral agreements governing international flights and the specific limitations on QR‘s operations in Australia. It highlights QR‘s utilisation of existing frequencies and its capacity flexibility due to a diverse fleet. It explores QR‘s existing schedule, the controversy around the second daily MEL flight, and QR‘s growth in capacity since entering the Australian market in 2010.
It assessed the potential impact, with claims of capacity increases contested. The analysis argued that assumptions about the additional frequencies’ impact may be overly optimistic and even unrealistic, highlighting the strategic benefit of additional frequencies timed to increase connectivity at QR’s DOH hub rather than simply increasing capacity. The analysis highlighted the diversity of QR’s network, and the importance of connecting traffic, particularly to/from Europe.
The conclusion emphasised QR‘s strategy to increase capacity and frequency to Australia, arguing that the market impact may be exaggerated. The analysis hinted at a follow-up on who stands to benefit from the decision, which this post now considers.
Who stands to benefit?
The bulk of QR’s Australian market is connecting traffic. QR is a typical stopover carrier, linking Australia to a large number of global destinations through DOH (their hub). Very few passengers flying between Australia and DOH are starting or ending their journey in DOH. A 2017 report estimated that 90% of QR passengers were connecting through DOH (network wide). Australian routes carry passengers connecting to multiple regions, although primarily to/from Europe, with smaller amounts connecting to Africa, the Middle East, and possibly even the Americas and parts of South Asia.
Between Australia and Europe, QR compete with direct carriers like QF and BA, but other stopover carriers, in the Middle East (e.g., EK and EY) and Southeast Asia (e.g., BI, CX, MH, SQ, and TG). The Middle Eastern carriers have the advantage of geography in that being closer to Europe they can offer more destinations than Southeast Asian carriers, whereas Southeast Asian carriers have the benefit of stronger O&D demand and a significant regional connecting markets. Other than BA, no European carriers serve Australia at present, rather partnering with Middle Eastern and Southeast Asian carriers through codeshare and joint venture arrangements.
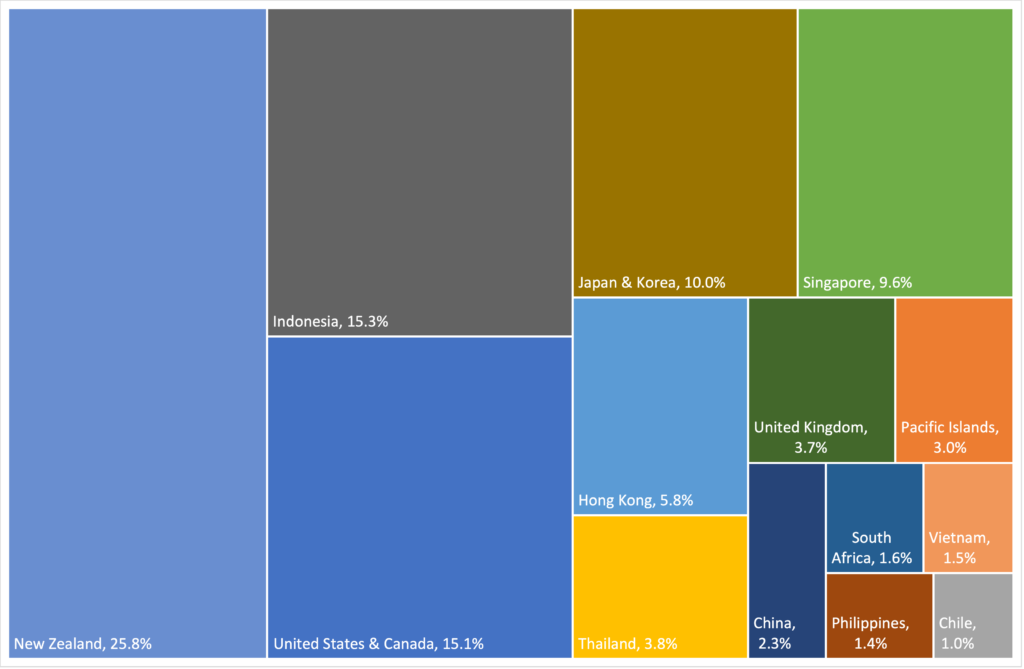
It is maybe surprising to many non-avgeeks, but QF‘s international and long-haul network is hardly dominated by destinations in Europe. At present, QF operate two daily flights to the UK, a daily A380 flight from SYD to LHR via SIN, and a daily B787-9 flight from MEL to LHR via PER. In 2022, QF inaugurated a 3x weekly seasonal service between SYD and FCO via PER. In 2019, Europe accounted for 5% of QF‘s international seat capacity (4% at a group level when including JQ). If only considering long-haul international seat capacity (i.e., excluding New Zealand and the Pacific), this rises to 8% (5% on a group level). Rather than Europe, QF‘s long-haul international operation is dominated by flights to the Americans (30% of seat capacity, 23% at a group level) and Asia (59%, 70% at a group level). Figure 1 shows the distribution of QF‘s 2019 seat capacity by country.
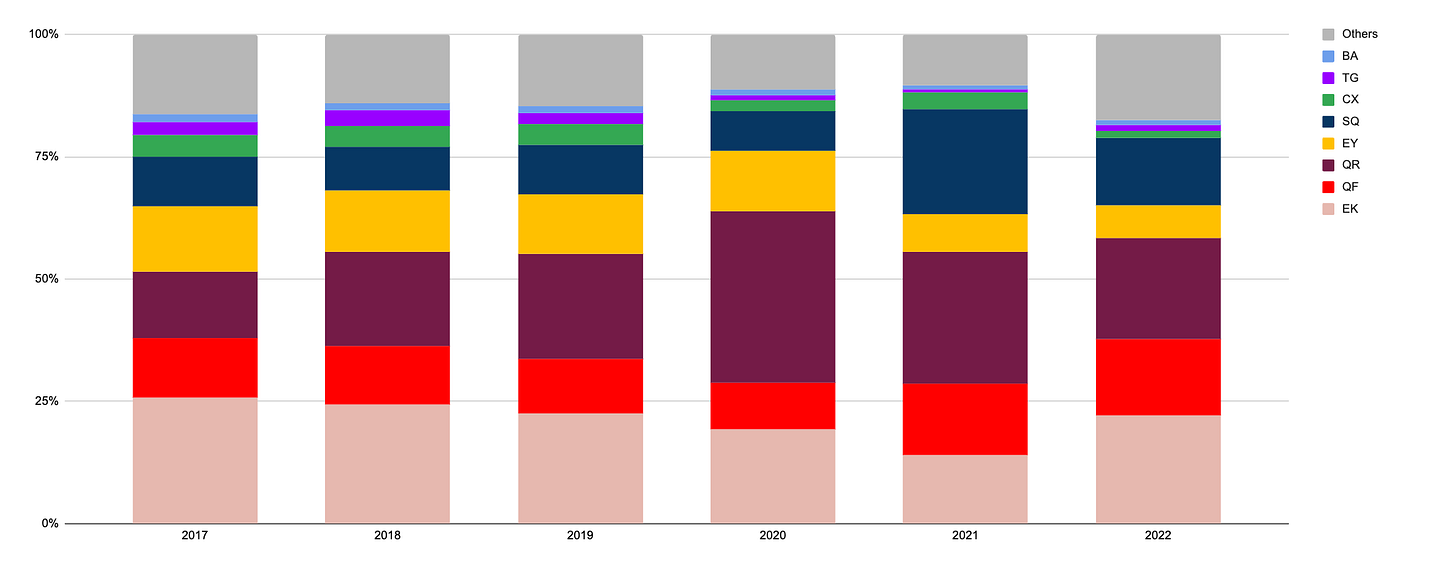
BITRE data establishes O&D capacity, but does not estimate the market share as few passengers travel on direct flights between Australia and Europe. During the ACCC‘s inquiry into the reauthorisation of the QF–EK joint venture, market share data was presented, broken down into Australia-UK and Australia-Europe (excluding the UK). These data provide for interesting reading, but the conclusion is clear: while QF is the market leader between Australia and the UK, it is certainly not when considering the rest of Europe. Furthermore, while the market leader, QF is also far from dominant. These data are shown in Figure 2, but can be summarised as follows:
Australia-UK
QF is the market leader, accounting for 32% of the UK market in 2022, however these data are not a fair reflection of historic trends due to delayed capacity returns following the COVID-19 pandemic.
Between 2017 and 2019, QF and EK were the joint market leaders with 20% of the market each.
Other significant carriers were SQ, EY, QR, CX, and BA, with an average of 12%, 11%, 10%, 7%, and 5%, respectively.
Post-pandemic, SQ, QR, and BA have increased their market shares to 13%, 12%, and 8%, respectively.
EK, EY and CX have struggled to recover from the pandemic, seeing their market shares decline to 15%, 5% and 4%, respectively.
Australia-Europe (excluding UK)
QF accounted for only 16% of the market in 2022, behind market leaders EK and QR with 22% and 21%, respectively.
Pre-pandemic, QF accounted for 12% between 2017 and 2019, in 5th place, behind EK, QR, EY and other carriers; EK was the clear market leader with 24%, followed by QR (18%), EY (13%), and SQ (10%).
While EY has struggled to recover from the pandemic (their market share has fallen to 7%), EK have done better at protecting their European market share (compared to the UK).
QR have also protected their market share, while SQ have been the beneficiary of EY‘s woes, increasing the market share to 14%.
QF have also increased their market share to 16%, likely the result of the introduction of seasonal flights to FCO in 2022.
Why are QF standing firm, and why are QR picking this fight?
It is not an easy task to assess which carriers stand to benefit the most from the Australian government’s decision to deny QR more access to the Australian market. The popular narrative is that QF benefits the most given their admission to lobbying the government to deny QR. Some of this is likely part of a pile-on on QF given the significant negative attention they’re (rightly) received in the media in recent times. The answer, however, may be somewhat more nuanced.
A significant challenge is this analysis is that post-COVID capacity returns have been uneven, with carriers operating under different constraints. Several carriers have yet to return to 2019 capacity levels, while other notable foreign carriers have yet to return to Australia (e.g., SA). While QR and SQ have returned much of their capacity, CX, EK, and EY have not (see list below). CX have struggled with longer lasting COVID-19 restrictions and domestic political issues, while EY‘s viability had been question even before the pandemic. EK have struggled with to return capacity due to staffing issues, but are likely to return their full capacity somewhat sooner.
CX operated only 52,936 outbound seats over 161 flights in February 2019, compared to 91,056 seats over 314 flights in February 2019.
EK operated 8,765 seats over 168 flights, compared to 146,925 seats over 351 flights in February 2019.
QR operated 67,892 seats over 166 flights, compared to 61,376 seats over 140 flights in February 2019.
SQ group (including TR) operated 190,650 seats over 600 flights in February 2019, compared to 194,983 seats over 652 flights in February 2019.
As the previous analysis highlighted, QR have significantly increased their capacity to Australia in recent years. Significant increases occurred in early 2016 (introduction of SYD and ADL), early 2017 (increasing gauge of MEL), and early 2018 (increase in SYD frequency). The data in Figure 2 shows that QR fed this traffic to their European rather than UK network, gaining an enormous 7.9 percentage points in market share between Australia and Europe between 2017 and 2019 (13.6% to 21.5%). Notably, they only gained 1.4 percentage points in market share between Australia and UK (9.3% to 10.7%) during the same period. EK and EY were the most significant victims of their success.
During a Senate committee hearing last month, QF CEO Alan Joyce specifically argued that QR should not be granted significant additional market access until incumbents had returned capacity. This certainly suits QF as they have been one of the beneficiaries of slow capacity returns. However, there is a strong case to be made that QR and SQ have been much larger beneficiaries than QF, given their strong European networks and ability to return capacity quicker than competitors. QF is has limited scope given the narrowness of their European network of LHR and FCO, with limited codeshare capacity via Southeast Asia (e.g., QF codesharing on AF‘s SIN–CDG flights). By comparison, at present, SQ (including TR) and QR operate to 14 and 41 destinations in Europe, respectively.
Conclusion
QF certainly benefit from the decision to limit additional market access to QR, however the benefit to QF is likely been overstated and even exaggerated. Many other airlines, particularly Middle Eastern and Southeast Asian stopover carriers are also substantial beneficiaries of the decision. Chief amongst them are SQ and EK. SQ‘s pandemic era market gains are being protecting while they are one of the few carriers with the means to exploit supply shortages. They have the fleet capacity and unlimited market access since Australia and Singapore have an open skies agreement. EK‘s slow capacity return means that the decision protects their dominant position being challenged further by QR. CX and EY are in a similar position to EK, although their smaller contemporary market share simply means less to loose.


