Chart of the week #19: The Rise and Rise of Jetstar
With Qantas’s half year results due 27 February we thought we’d remind everyone just how important Jetstar has become to the Qantas Group. Six months ago when Qantas reported 2024 full year results, our analysis reinforced the strategic importance of Jetstar to the group.
It’s often misunderstood, but Jetstar isn’t just a LCC or a competitive point for Qantas to compete against other LCCs. It’s a strategic platform that allows Qantas to segment the market more deliberately. It allows them to drive higher yield traffic onto increasingly more premium heavy aircraft and lower yield traffic onto an entirely lower cost base.
But this week’s “Chart of the week” isn’t at all about that, rather a reminder just how important Jetstar has become to the group’s capacity. Jetstar is more important in shaping the group’s capacity trends than Qantas mainline, although that shouldn’t be interpreted to mean that it’s fiscally more important.
We took a look at Qantas’s Annual Financial Statements, going all the way back to 2007 to see the evolution of Available Seat Kilometers (ASKs) across Qantas mainline and Jetstar’s domestic and international operations. ASKs are a common measure of aggregate capacity, weighting each route by seats and distance.
While Qantas mainline remains larger than Jetstar in both the domestic and international sphere, the trends are very different! Since 2007, Qantas mainline’s domestic and international ASKs have fallen by 1% and 21%, respectively, resulting in total capacity declining 15%.
Meanwhile, Jetstar’s domestic and international ASKs have surged 112% and 488%, respectively, and total capacity by 225%. Group-wide, domestic and international capacity has increased by 25% and 7%, respectively, and total capacity by 13%.
A different perspective is to view Jetstar’s ASKs as a proportion of group capacity. Jetstar’s domestic operation now accounts for 39% of ASKs, up from 23% in 2007, while international capacity has risen to 30% from a much lower base of just 5% in 2007. Combining domestic and international operations Jetstar now accounts for 33% of group capacity, up from just 12% in 2007. It really is a case of the “Rise and Rise of Jetstar”!!!
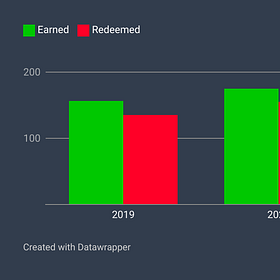
Just a reminder of our last “Chart of the week”, a look at the recent evolution of Qantas Frequent Flyer points earning and redemption, and why a surge in new members is partly to blame for recent changes to QFF.
Chart of the week #18: What's behind the recent Qantas Frequent Flyer changes?
Last week Qantas announced changes to the Qantas Frequent Flyer programme. The changes included a big increase in the number of points required to redeem classic awards, partially offset by an increase in earnings on selected flights. As expected, the changes have come in for some criticism but not to the same extent as recent changes by British Airways…


