

How Qantas is getting more long haul flying out of the A330-200s
The Airbus A330 has become one of the world’s most capable and reliable medium/long-haul aircraft since its introduction in the early 1990s. Continuous improvements have increased the aircraft’s performance and efficiency, allowing airlines to fly larger payloads over longer distances at a very competitive cost. Combined with its reliability, this has made it a popular choice amongst airlines.
Qantas have a fleet of 26 passenger A330s, comprising 16 of the smaller A330-200 and 10 of the larger A330-300. The A330-200s are operated in two configurations, 8 in a higher density “domestic” and 10 in a lower density “international” layout. Both have the same lie-flat business class seat (Thompson Aero Vantage XL), but different economy class seats with the domestic layout combining more seats with the lack in-seat screens for the in-flight entertainment system.
Historically, the domestic A330-200s were frequently found on trunk routes between Brisbane, Melbourne and Sydney, and transcontinental flights to Perth and trans-Tasman flights to Auckland. Occasionally, they could be spotted elsewhere on domestic network as seasonal upgrades, capacity increases, or as network recovery flights. Their use on international flights was generally limited to shorter routes to Indonesia or Singapore (ex Perth), or occasionally as a replacement when another A330 was unavailable.
Over the last year, domestic A330s have become a fixture on international flights to Asia due to Qantas’s well documented post-COVID fleet constraints. For example, during March 2024, domestic A330s flew 46 of 54 Melbourne-Singapore flights (QF 35 and 37), with only 8 flown on internationally configured A330-200 and -300s.

Where has the A330-200 flying time come from?
Increasing flights to Asia has necessitated reducing flying elsewhere in the network. Managing network changes is more complex than it first appears. For example, replacing A330s with B737-800s on Sydney-Melbourne flights reduces total capacity. Capacity can be maintained through increasing frequency, but this requires more B737s and uses more slots that are scarce commodities at both Melbourne and Sydney, particularly at peak times, meaning that a significant opportunity cost.
A330 flights have also become less common on trans-Tasman services, leading to significant adjustments that reflects a substantial strategic network shift and reconfiguration across the Qantas group.
Qantas’s New Zealand network
At present, Qantas fly multiple daily flights to Auckland from Brisbane, Melbourne and Sydney, with Christchurch, Queenstown and Wellington also served Brisbane, Melbourne and Sydney at a variety of frequencies. Qantas have also served Auckland from Adelaide and Perth at various times. Qantas also flies fifth freedom routes to the United States via New Zealand. At present, this includes Sydney to New York via Auckland, but they have also served Los Angeles via Auckland in the past.
Jetstar also serves New Zealand, with Auckland being served from Brisbane, Gold Coast, Melbourne and Sydney, and Christchurch from Gold Coast and Melbourne. Wellington is only served from Gold Coast, while Queenstown is served from Gold Coast, Melbourne and Sydney.
Excluding fifth freedom flights, group capacity to New Zealand has fully recovered and exceeded pre-COVID capacity. In the year to January 2024, group capacity had increased by 3% compared to the year to January 2020, with Qantas and Jetstar increasing capacity by 1.0% and 7.3%, respectively. Qantas accounts for 71% of the total group capacity. Figure 1 shows the steady increase in capacity by both Qantas and Jetstar since 2006.
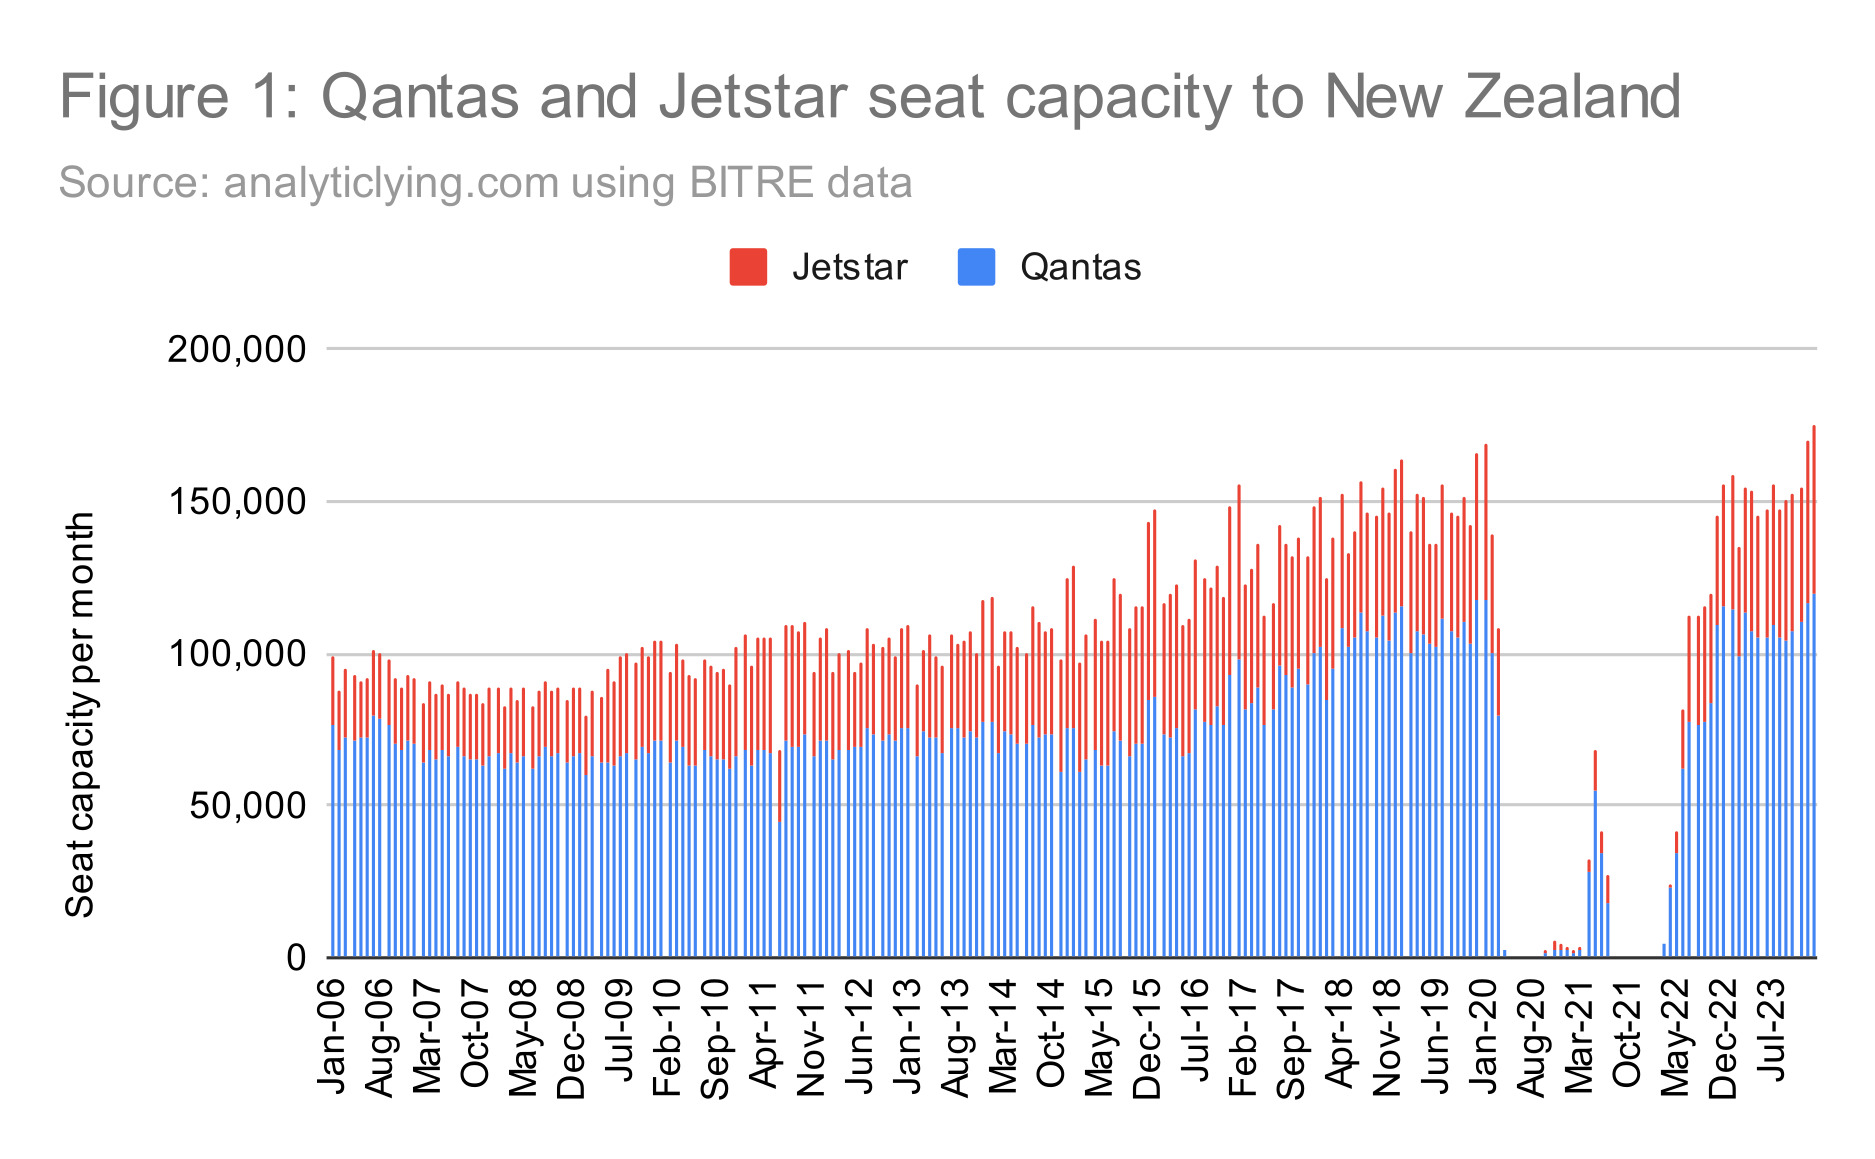
Capacity is concentrated on Auckland, with 55% and 53% of Qantas and Jetstar’s capacity landing in Auckland. Similarly, on the Australian side capacity is concentrated with 50% of Qantas’s capacity flying from Sydney. Jetstar’s capacity is more fragmented, with Sydney only accounting for 26%, however at a group level Sydney accounts for 43% of capacity.
Evolution of aircraft size on Auckland routes
Since nearly all Jetstar flying to New Zealand is on the A320 (A321LR only flies one daily BNE-AKL rotation at present), and since all Qantas flights to Christchurch, Queenstown and Wellington are flown by the B737 and E190, we will focus on Qantas’s Auckland routes, mostly flown by a combination of B737s and A330s.
BITRE publishes data on total capacity and flights per month for each city pair, allowing estimation of the average seats per flight. Using these data we observe that Qantas flights to Auckland experienced fairly significant declines in gauge between 2006 and 2012 (Figure 2). For example, flights from Melbourne and Sydney declined from an average of 234 and 237 seats per flight in 2006 to 168 and 171 seats per flight in 2012. Brisbane declined from a smaller base of 209 to 168 seats per flight, while the average for all flights to Auckland declined from 226 to 169 seats per flight.

Smaller aircraft didn’t necessarily result in a decline in capacity. Capacity from Melbourne increased by 75% between 2006 and 2012, driven by a 144% increase in the number of flights (Figure 3). Brisbane followed the trend but with smaller 25% increase in capacity and 54% increase in the number of flights.
The trend from Sydney was somewhat different with a 25% reduction in capacity with the number of flights remaining relatively unchanged (1,729 and 1,793 in 2006 and 2012). Sydney’s decline was driven by a reduction in gauge, whereas the increases from Melbourne and Brisbane likely resulted from more flights flown by smaller aircraft rather than the reduction in flying of larger aircraft. It’s clear that the average seats per flight is not a strong indicator by itself of whether Qantas are employing fewer A330s on trans-Tasman routes. The average seats per flight needs to be interpreted alongside other data including total capacity and number of flights.
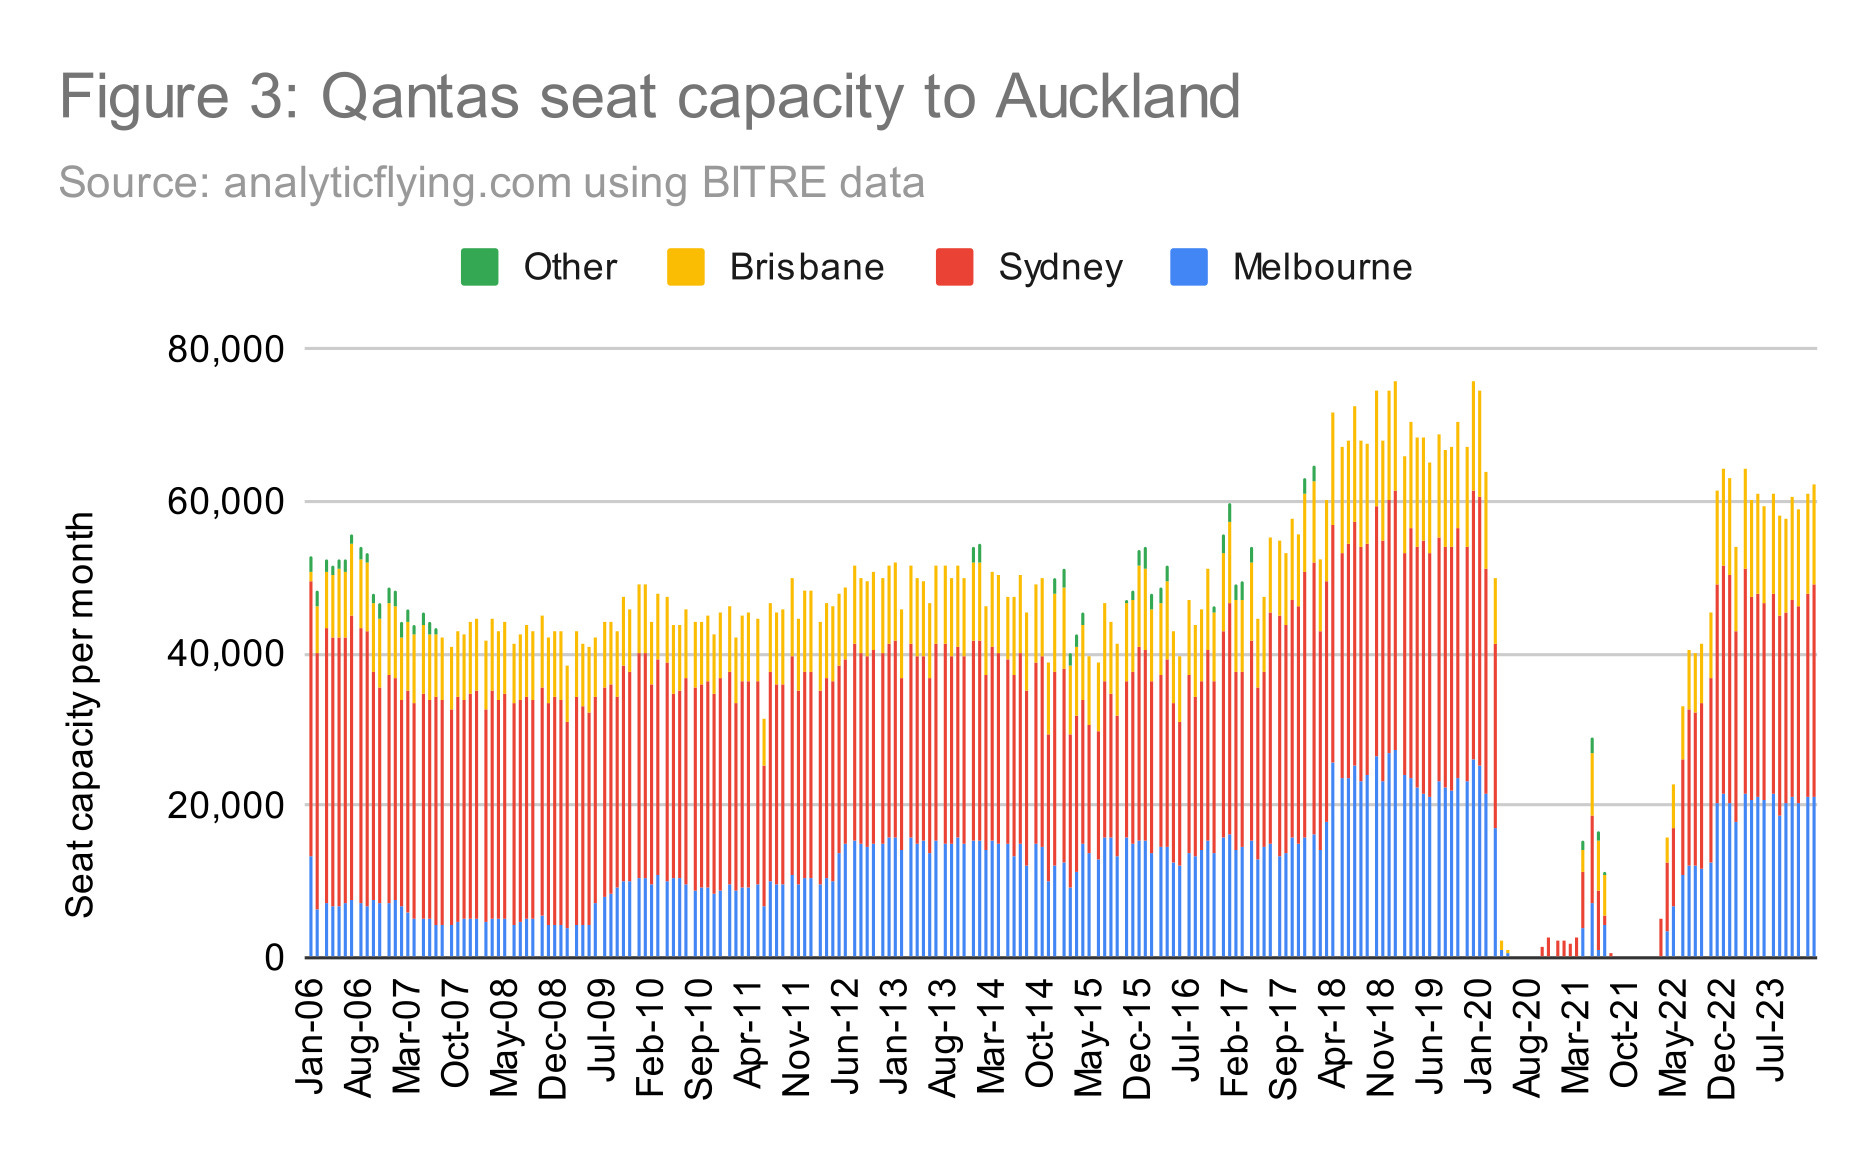
As an aside, the decline in capacity from Sydney exceeded the gains from Melbourne and Brisbane (and other routes) resulting in a 5% net capacity decline between 2006 and 2012. This must also be viewed alongside capacity changes elsewhere. For example, Qantas capacity to Christchurch also declined, but capacity to Wellington and Queenstown increased, with a 3% net decline in Qantas’s New Zealand capacity. Jetstar’s capacity to New Zealand increased dramatically during this time, resulting in group capacity increasing 8%. This highlights the evolution in Qantas’s network strategy of segmenting traffic across two brands and operations. This was aided by the liberalisation of air services between Australia and New Zealand (beginning in 2000) that we covered in detail in a previous blog on fifth freedom routes last year.
Qantas’s average aircraft size to Auckland remained remarkably stable through to 2017. A small increase in 2017 from Brisbane and Melbourne reflects a cabin refit of the B737s which increased seating capacity from 168 to 174 seats. Essentially, all Auckland flying during this time was covered by B737s as the average seats per flight hovered around 168 and 174.
A substantial change occurred in 2018, with Qantas significantly increasing capacity to offset capacity declines from Emirates’s fifth freedom routes as part of their joint venture agreement (this was also discussed in a previous blog analysing the ACCC’s approval of the extension of the joint venture last year). The increase in capacity was driven by an increase in gauge and the number of flights, indicative of greater use of larger aircraft on the routes. For example, between 2017 and 2018:
Brisbane-Auckland capacity increased 33%, driven by a 10% increase in the number of flights and a 20% increase in the average seats per flight from 174 to 210.
Melbourne-Auckland capacity increased 54%, driven by a 27% increase in the number of flights and a 20% increase in the average seats per flight from 174 to 210.
Sydney-Auckland capacity increased 12%, driven by a 5% increase in the number of flights and a 7% increase in the average seats per flight from 195 to 219. The increase in gauge began in a little earlier than Brisbane and Melbourne.
How many additional A330 flights did Qantas fly to Auckland?
In 2019, Qantas flew an additional 396 flights to Auckland compared to 2018, providing an additional 164,878 seats, meaning the average additional flight averaged 416 seats per flight, significantly more than an A330. This indicates that A330s didn’t just cover the additional flights but also backfilled a significant amount of the existing schedule.
Assuming all 396 additional flights were operated by the domestically configured A330-200s (271 seats), this would account for 107,316 of the 164,878 additional seats. Based on the difference in size between the A330-200 and B737-800 (97 seats), this implies that an additional 593 flights would have been required to have flown on A330s. In total, an additional 1,009 A330 flights were operated to Auckland in 2018.
However, earlier we noted that the the increase in gauge was implemented in Sydney the year before. Using the same method we estimate that an additional 438 A330 flights between Sydney and Auckland were brought online in 2017. Thus, a total of 1,427 additional flights to Auckland were operated by A330s, averaging 3.9 per day in each direction.
How have Auckland flights evolved post-COVID?
Like many other international routes, capacity to Auckland has returned relatively slowly. Qantas’s Auckland capacity has now yet fully recovered, experiencing a 13% decline seat capacity for the year to January 2024 (compared to the year to January 2020). The decline in capacity has exceeded the decline in number of flights, indicating a significant decline in average gauge, however trends differ by city pair:
Brisbane-Auckland capacity declined 4% despite no significant change in capacity, highlighting a decline in the average seats per flight of 4% from 221 to 212.
Melbourne-Auckland capacity declined 2% despite an increase in flights of 1%, highlighting a decline in the average seats per flight of 13% from 200 to 174.
Sydney-Auckland capacity declined 12%, driven by a 6% decline in the number of flights and a 13% decline in the average seats per flight from 212 to 184.
Using the same methodology in reverse, Qantas flew 3,870 fewer flights to Auckland over the last year. If all were flown by B737s, this would only account for 673,380 of the total capacity of 718,852. The difference of 45,472 seats would require 469 A330 flights at the marginal capacity difference between the B737 and A330. Thus, we estimate that Qantas have reduced the number of A330 flights to Auckland by 958 per year or an average of 2.6 per day in each direction compared to the pre-COVID benchmark.
Conclusion
While 2.6 daily return rotations between Brisbane, Melbourne or Sydney an Auckland may not sound like much, it represents a significant “block” time. Together with a 70 minute turnaround (currently what Qantas use for planning purposes on contemporary Auckland A330 flights), the total block time for a return rotation varies from 7 hours and 50 minutes from Sydney to 8 hours and 50 minutes from Melbourne.
Most of Qantas’s Asian flights depart Australia in the morning or early afternoon, returning overnight from Asia. For example, Melbourne-Singapore departs Melbourne at noon and 3:50pm (returning at 5:35am and 8:50am), while Brisbane-Singapore departs Brisbane at 11:05am (returning 6:05am), and Sydney-Jakarta departs Sydney at 1:55pm (returning 6:50am). Reducing A330 flying on trans-Tasman routes is insufficient to generate the required block time to enable the increased Asian flying.
Earlier in the analysis we argued that reductions in A330 flying on domestic routes, including Perth to east coast, has been observed. Notably, late afternoon and overnight A330 departures from Perth to the east coast have become less common. At present, A330s are operating only 5x weekly late afternoon and 6x weekly late evening (i.e. overnight) departures to Melbourne, 5x weekly late evening departures to Sydney, and none to Brisbane. When combined with the reduction in trans-Tasman A330 flying, this supports the redeployment of the A330s to Asia.
The reduction in A330 flying also means an increase in B737 flying. This is somewhat confusing given the well documented increases in post-COVID domestic flying. Thankfully, the answer is a little easier to explain! While Qantas’s widebody fleet has shrunk post-COVID, the narrowbody fleet has grown.
Between April 2019 and 2024 the mainline fleet remained unchanged, however QantasLink saw a net increase in 23 aircraft, taking delivery of A220s, A319s, A320s and E190s that have replacing retiring B717s and Fokkers and provided growth. Some A320s were internal transfers from Jetstar, however Jetstar itself experienced a net increase of 10 aircraft (excluding Jetstar Asia, Pacific and Japan).
Qantas have pursued a similar strategy to Jetstar who increased long haul flying by displacing long haul aircraft with short haul aircraft flying medium haul routes. In Jetstar’s case, they replaced B787 flying to Bali with A321LRs, allowing the redeployment of the B787s on longer sectors to Korea and Japan. This intriguing strategy was covered in its own blog a few months back. Qantas have adapted their trans-Tasman network, displacing A330s with more B737 flying. In turn, the additional B737 flying has likely been accomplished through increased capacity under the QantasLink brand on domestic flights employing their growing fleet.
This conclusion raises a secondary question how Qantas have adapted the rest of their trans-Tasman network. Specifically, has the reduced Auckland capacity been offset by increases elsewhere, either by additional capacity to other destinations in New Zealand or by additional capacity operated by Jetstar? This is a question for another time and we will return to this with an additional blog next week.
Correction: First version of the blog indicated that all Jetstar flying to New Zealand is on the A320. This was not correct and has been corrected. Thanks to twitter.com/Mick55629336 for pointing out the error.